As I discussed yesterday, it’s a week out from Election Day and the polls are not looking good for Donald Trump. The question on everyone’s mind is whether the polls could be off, leading to another unexpected result similar to 2016. Democrats are fearfully considering the possibility while Republicans are clinging to the hope that Trump can once again beat the odds.
The only way to answer that question for sure is to wait until next Tuesday, but we can gain some insights by comparing 2020 polling to that of 2016. Real Clear Politics has archived the final polls of 2016 for comparison to current polls.
On a national level, we see a very different race between 2016 and 2020. The race between Hillary and Trump was consistently much closer than the Biden-Trump race. Over the course of the 2016 campaign, Trump led in the polling average at least four times. In 2020, Trump has never been ahead of Joe Biden.
Hillary also maintained a much smaller lead than Biden. Over the final months of the campaign, when she was bedeviled by Wikileaks, Hillary never opened up a lead of more than seven points. In contrast, Biden’s lead over the same time period has not fallen to less than six points.
Further, the closing weeks of the campaign show a sharp decline for Clinton. Hillary’s polling average peaked on Oct. 18 and then began a decline that continued until Election Day on Nov. 8. Donald Trump experienced a sharp increase a few days later, which coincides perfectly with the release of James Comey’s letter to Congress on Oct. 28.
What do the polling trends show this year? Biden did begin a decline on Oct. 10. This predates the publication of the Hunter Biden emails on Oct. 14. At the same time, Trump closed slightly in the polls. The difference is that Hillary began her decline with a seven-point lead where Biden held a 10-point lead. As of this writing, Biden maintains a 7.3-point average lead even after the polls have tightened.
Finally, Hillary was never able to close the deal with voters. In the last days of the campaign, she never averaged better than 49 percent. In contrast, Biden is currently at 50.5 percent even after his polling drop.
Now, let’s look at the swing states. We’ll compare the current polling averages with the archived data from 2016. States where the result was contrary to polling are denoted by an asterisk.
- Arizona
2016 polling spread – Trump +3.5
2016 result – Trump 4.0
Current polling spread – Biden + 2.2 - Colorado
2016 polling spread – Clinton + 4.9
2016 result – Clinton + 2.9
Current polling spread – Biden + 9 - Florida
2016 polling spread – Trump + 0.2
2016 result – Trump + 1.2
Current polling spread – Biden + 1.2 - Georgia
2016 polling spread – Trump + 4.8
2016 result – Trump + 5.1
Current polling spread – Trump + 0.4 - Iowa
2016 polling spread – Trump + 3.0
2016 result – Trump + 9
Current polling spread – Biden + 0.8 - Michigan*
2016 polling spread – Clinton + 3.4
2016 result – Trump + 0.3
Current polling spread – Biden + 9 - Nevada*
2016 polling spread – Trump + 0.8
2016 result – Clinton + 2.4
Current polling spread – Biden + 5.2 - North Carolina
2016 polling spread – Trump + 1.0
2016 result – Trump + 3.7
Current polling spread – Biden + 1.2 - Ohio
2016 polling spread – Trump + 3.5
2016 result – Trump + 8.1
Current polling spread – 0.6 - Pennsylvania*
2016 polling spread – Clinton + 1.9
2016 result – Trump + 0.7
Current polling spread – Biden + 4.5 - Wisconsin*
2016 polling spread – Clinton + 6.5
2016 result – Trump + 0.7
Current polling spread – Biden + 5.5
As you can see, the state polls were not exact. In some cases the error benefitted Clinton, but in others it benefitted Trump. Clinton outperformed the polls in New Mexico and Nevada, where the polling average picked Trump to win, but we don’t hear about these examples because the election did hinge on these states.
There were only four states where the final results did not match the polls (Michigan, Nevada, Pennsylvania, and Wisconsin) and the election swung on three of them. In three of the four states, the polling error was about four points or less, which would have been within the margin of error of most polls. The 7.2-point error in Wisconsin is the exception.
A post-mortem of 2016 polling error by the American Association for Public Opinion Research found several reasons for the erroneous polls. These include shifting preferences in the closing days of the campaign, underrepresentation of non-college graduates, and late-revealing Trump voters.
So could the same factors skew the 2020 election in key states? I’m skeptical for several reasons. First, Biden’s lead is larger than Clinton’s but in terms of national polling and the Electoral College. Biden leads Trump in a number of battleground states in which Trump led in 2016. That means that a larger polling error would be required to swing the election or an individual state than in 2016.
And pollsters aren’t using the same models that they used in 2016. It would be a mistake to assume that pollsters didn’t look at the 2016 results and try to learn from their mistakes. It is doubtful that pollsters will repeat the same errors they made last time, but correcting those mistakes might lead to new errors. It is just as likely that Joe Biden will outperform this year’s polls, which are trying to correct for undercounting Trump voters last time, as it is that they will err against Trump again. The AAPOR report found “no consistent partisan favoritism in recent U.S. polling.”
Finally, there were far more undecided voters in 2016 than today. Donald Trump was a relatively unknown quantity and many people assumed that he could become more serious and presidential if he won the elections. Today, voters know and dislike Trump. Fifty-six percent of voters believe that Trump does not deserve re-election. This is slightly higher than the 52 percent who said last year that they would not support Trump. In states where Biden leads by more than 50 percent, it is unlikely that late-deciding voters will swing the election to Trump.
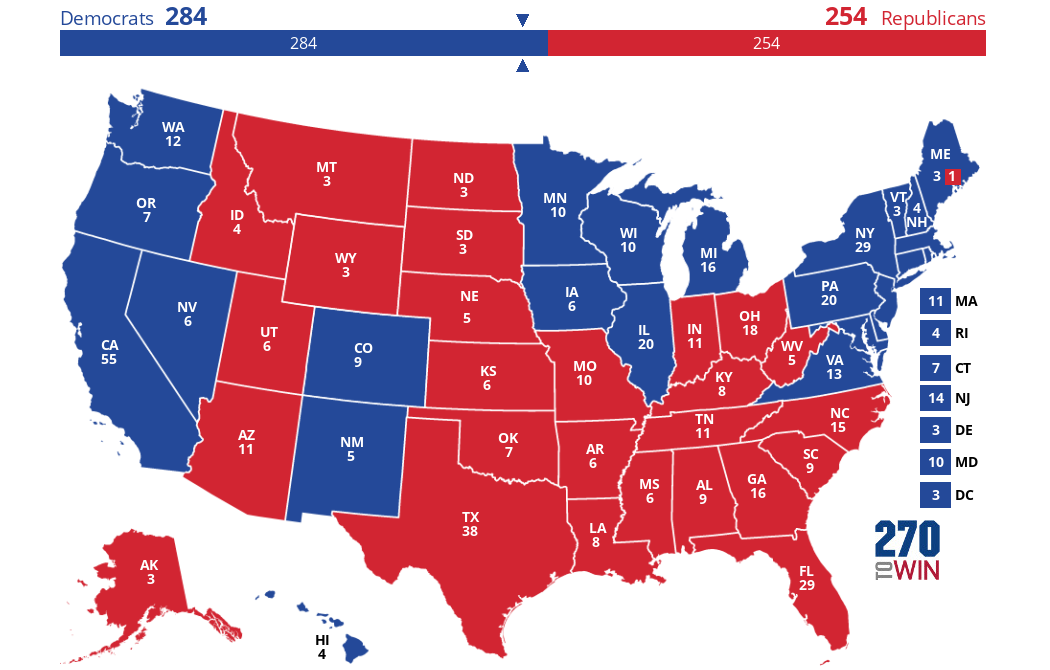
Donald Trump’s difficulty this year is illustrated by the fact that, even if he ran the table on every swing state where he is trailing by less than four points, he would still lose the election, as shown by the map below. The president would need to win at least one of the three Rust Belt states where Wisconsin-size polling errors are required.

We are unlikely to see a repeat of Trump’s surprise victory this year. Joe Biden holds a larger lead that would require a bigger error to change results at a time when pollsters are very keen to overcome their mistakes from 2016. At the same time, most voters have made up their minds about the election years ago.
Barring another Comey letter that upends the race at the last moment, there seems little chance of a last-minute Biden collapse. With almost half of the electorate having already cast ballots in early voting, there is a diminishing chance that even an October surprise of YUGE proportions could remake the race.
The First TV contributor network is a place for vibrant thought and ideas. Opinions expressed here do not necessarily reflect those of The First or The First TV. We want to foster dialogue, create conversation, and debate ideas. See something you like or don’t like? Reach out to the author or to us at ideas@thefirsttv.com.

